Asset Risk Score
Under the hood, Plerion uses the Plerion Risk Calculator (PRC) – an algorithm that generates the Asset Risk Score, a score assigned to an asset based on its findings and vulnerabilities.
Implementation Overview
The factors that contribute to an Asset Risk Score are:
- Public exposure
- Asset contexts
- Findings algorithm
- Vulnerability severity algorithm (applicable only for workload assets)
Factors in Asset Risk Score Calculation
Asset Contexts
The PRC considers various asset contexts specific to the resource type. These asset contexts contribute to the Asset Risk Score based on their relevance and Plerion-defined importance.
This is the list of all asset contexts:
* Publicly exposed
* Admin privileges
* Overly permissive privileges
* Cross account access
* Exploit exists
* Exploited vulnerability
* Susceptible to privilege escalation
Note: The asset contexts listed above might not apply to all resource types. For example, for an S3 Bucket, apart from the public exposure, the only asset context applicable from the above list would be cross account access.
Findings Algorithm
The findings algorithm calculates a score between 0 to 10 for an asset using a banding system that starts the score based on the highest severity level among failed findings. The algorithm then adjusts the score depending on the ratio of failed to passed and missing findings, ensuring the score remains within the appropriate band. To provide you with the most accurate assessment, we carefully avoid double-counting any risks. This means that findings related to public exposure or specific asset contexts, which we've already accounted for earlier in the risk score calculation, are not included again in this part of the assessment.
The severity levels and their corresponding bands are:
Low → (1...<3)
Medium → (3...<7)
High → (7...<9)
Critical → (9...10)
The process works as follows:
- Identify the Highest Severity Band: The algorithm begins by identifying the highest severity band among the failed findings.
- Edge Case Handling: If the asset has only failed findings (with no passed or missing findings), the score is set just below the start of the next highest band. This prevents the score from exceeding the current band too drastically.
- Calculate Failure Ratio: The failure ratio is determined by comparing the number of failed findings to the total number of findings (including passed and unknown).
- Apply Normalization Factor: A normalization factor specific to the highest severity band is applied to scale the score within the band's range.
- Compute the Risk Score: The final risk score is calculated by adding the highest severity band to the product of the failure ratio, a multiplier (10), and the normalization factor.
- Cap the Risk Score: The score is capped at a maximum of 10.
Example: Consider an S3 Bucket with the following findings:
Failed Severities: Critical, High
Passed Severities: Low, Medium
Unknown Severities: None
Using the findings risk score algorithm, the score for this S3 Bucket would start at the band for the highest failed severity (Critical, starting at 9). The score is then adjusted based on the failure ratio and normalization factor, resulting in a final risk score close to 9.8.
Vulnerability Algorithm
The vulnerability algorithm calculates a score between 0 to 10 for an asset using the severity of an asset's vulnerabilities. The algorithm uses a banding system with limits for each severity level. The severity levels and their corresponding bands are:
Low → (1...<3)
Medium → (3...<7)
High → (7...<9)
Critical → (9...10)
Each severity level has a defined limit:
Low → 4000
Medium → 2000
High → 500
Critical → 100
Step-by-Step Process:
- Identify the Highest Severity: The algorithm begins by identifying the highest severity level present among the vulnerabilities.
- Start from the Highest Band: The risk score calculation starts at the band corresponding to the highest severity level. For example, if the highest severity is "Critical," the starting point is band 9.
- Calculate Remaining Band Range: The remaining range within which the score can increase is determined by the difference between the current band and the next highest band. For instance, if starting from band 9, the range to the next band (10) is 1.
- Evaluate Severity Levels: The algorithm then checks for vulnerabilities in lower severity levels (High, Medium, Low) and calculates their contribution to the risk score. The contribution is based on the ratio of the number of vulnerabilities to the severity limit and is weighted according to the remaining band range.
- Aggregate Contributions: Contributions from lower severity levels are progressively added to the risk score. The critical vulnerabilities contribute the most, followed by high, medium, and low severities.
- Cap the Final Score: The final risk score is capped at a maximum of 10 to ensure it stays within a standardized range.
Example:
For an EC2 instance with 5 critical vulnerabilities, 25 high vulnerabilities, and 100 medium vulnerabilities:
Highest Severity: Critical, so start at band 9.
Remaining Band Range: 1 (10 - 9).
Critical Contribution: 5/100 = 0.05. The score becomes 9 + 0.05 = 9.05.
High Contribution: 25/500 = 0.05. The score becomes 9.05 + (0.05 / 2) = 9.075.
Medium Contribution: 100/2000 = 0.05. The score becomes 9.075 + (0.05 / 4) = 9.0875.
The resulting risk score for this instance would be approximately 9.0875
Risk Score Calculation Process
Public Exposure Check
If the asset is publicly exposed, add 3 points to the risk score.
Asset Contexts Evaluation
Calculate a score based on the relevant asset's contexts for the resource type. The evaluation process involves:
- Identifying which asset contexts apply to the specific asset based on the asset's resource type.
- Assigning weights to each applicable asset context based on its importance(risk weight).
- Calculating a score that reflects the overall risk posed by the asset's contexts.
The maximum score for this component is determined dynamically based on the resource type but capped at 3 at maximum.
Findings and Vulnerabilities
After accounting for public accessibility and asset contexts, the remaining portion of the risk score is calculated based on findings and vulnerabilities. This calculation differs for non-workload and workload assets:
-
For non-workload assets:
- Calculate the remaining risk score based solely on the findings.
-
For workload assets:
-
If the asset has not been scanned for vulnerabilities:
- Use only the findings score.
-
If the asset has been scanned but has no vulnerabilities:
- Use 50% of the findings score.
-
If the asset has vulnerabilities:
-
For assets with only asset context findings:
- Use 100% of the vulnerability score.
-
For assets with other findings:
- Use 30% of the findings score and 70% of the vulnerability score.
-
-
Final Score Calculation
-
Sum up the scores from public exposure, asset contexts, and findings and vulnerabilities algorithm.
-
Ensure the final score is within the 0-10 range.
Examples
To better illustrate how the risk score is calculated, let's look at a few examples:
Example 1: Non-Workload Asset (SNS Topic)
Let's consider an SNS Topic with the following characteristics:
- Publicly exposed
- Has two applicable asset contexts: "Cross account access" (weight: 2) and "Admin privileges" (weight: 1) and only the "Cross account access" is set for the asset
- Has findings: 1 Critical, 2 High, 1 Medium
Calculation:
- Public Exposure: 3 points
- Asset Contexts:
- Max score for SNS Topic: 3
- Score: 2 / (2 + 1) * 3 = 2 points
- Findings:
- Assuming our findings algorithm gives a score of 8.5 out of 10 for these findings
- Remaining max score: 10 - 3 - 3 = 4
- Findings score: 8.5 / 10 * 4 = 3.4 points
- Final Score: 3 + 2 + 3.4 = 8.4
Example 2: Non-Workload Asset (SQS Queue)
Let's consider an SQS Queue with the following characteristics:
- Publicly exposed
- Has one applicable asset contexts: "Cross account access" (weight: 1) and it is set for the asset
- Has findings: 1 Critical, 2 High, 1 Medium
Calculation:
- Public Exposure: 3 points
- Asset Contexts:
- Max score for SQS Queue: 1
- Score: 1 / 1 * 1 = 1 point
- Findings:
- Assuming our findings algorithm gives a score of 7 out of 10 for these findings
- Remaining max score: 10 - 3 - 1 = 6
- Findings score: 7 / 10 * 6 = 4.2 points
- Final Score: 3 + 1 + 4.2 = 8.2
Example 3: Workload Asset (EC2 Instance) Now let's consider an EC2 instance with these characteristics:
- Not publicly exposed
- Has three applicable asset contexts: "Admin privileges" (weight: 2), "Exploit exists" (weight: 1) and "Exploited Vulnerability" (weight: 1) but only the "Admin privileges" asset context is set for this asset
- Has findings: 2 High, 3 Medium
- Has been scanned for vulnerabilities and has: 1 Critical, 3 High vulnerabilities
Calculation:
- Public Exposure: 0 points
- Asset Contexts:
- Max score for EC2 instances: 3
- Score: 2 / (2 + 1 + 1) * 3 = 1.5 points
- Findings and Vulnerabilities:
- Assuming our findings algorithm gives a score of 7.0 out of 10 for these findings
- Assuming our vulnerability algorithm gives a score of 8.5 out of 10 for these vulnerabilities
- Remaining max score: 10 - 3 - 3 = 4
- Combined score: (0.3 * 7.0 + 0.7 * 8.5) * 4 / 10 = 3.22 points
- Final Score: 0 + 1.5 + 3.22 = 4.72
These examples demonstrate how different factors contribute to the overall risk score for both non-workload and workload assets.
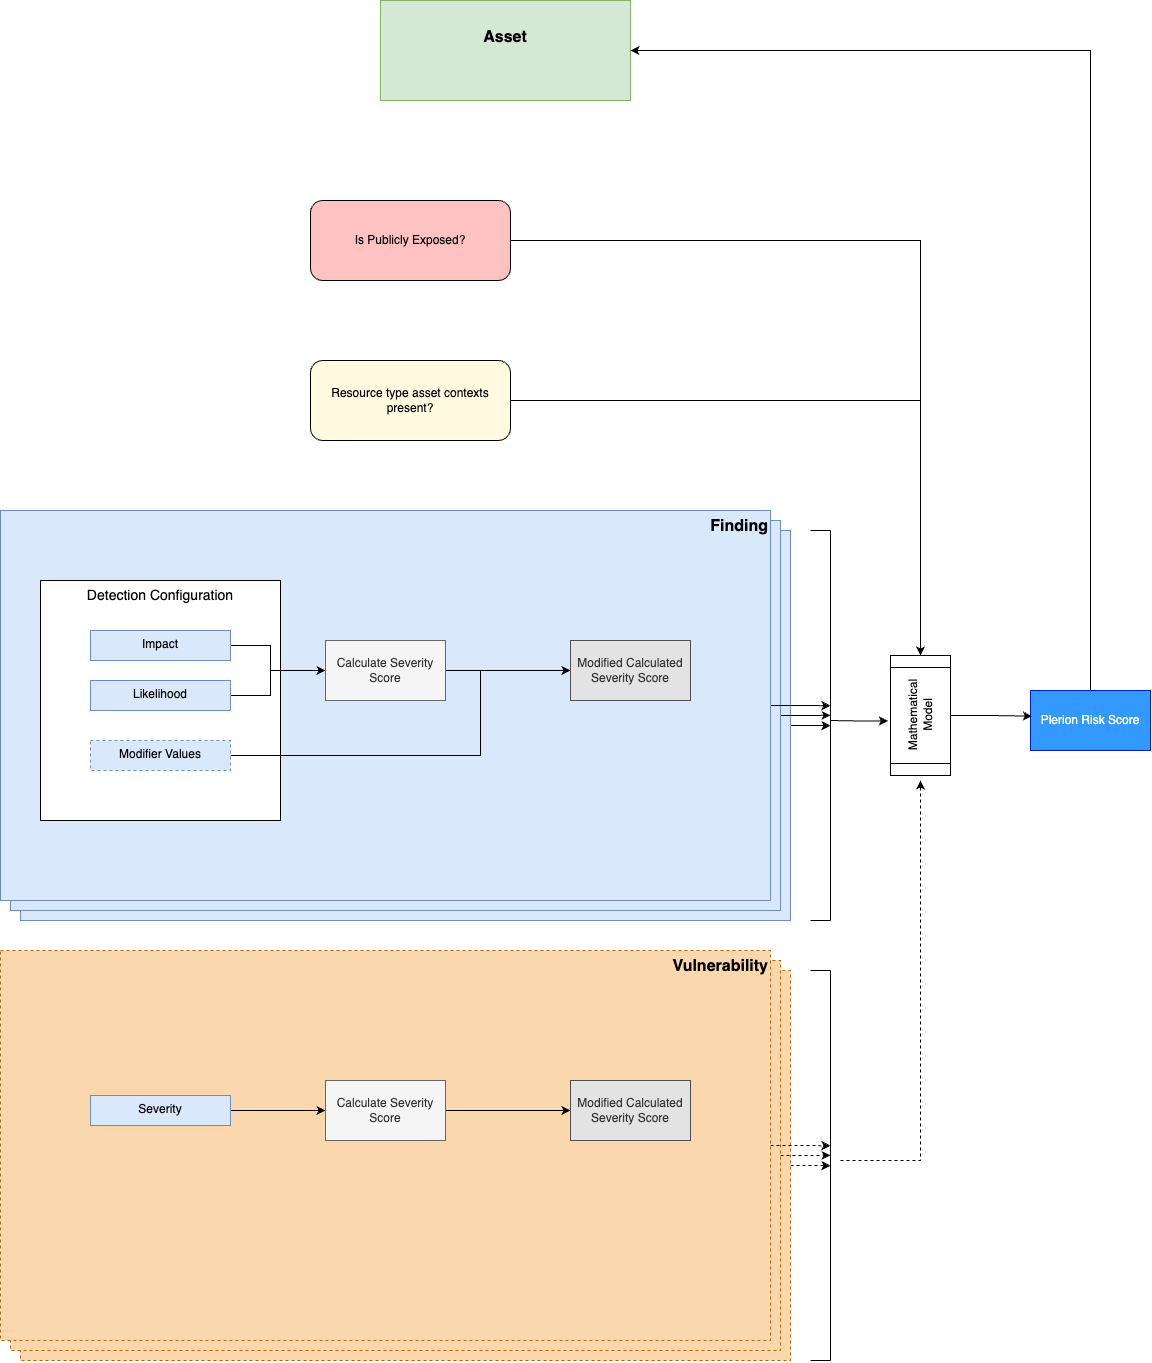
Depiction