Understanding Metrics Trend Widget: Data Source and Filters
The Metrics Trend widget displays a trend/line chart for your data over time. You can use this widget to track the trends of various metrics.
Supported Data Sources
When you choose the 'Metrics Trend' widget type, you can select from the following data sources:
- Findings (integration-level metrics supported)
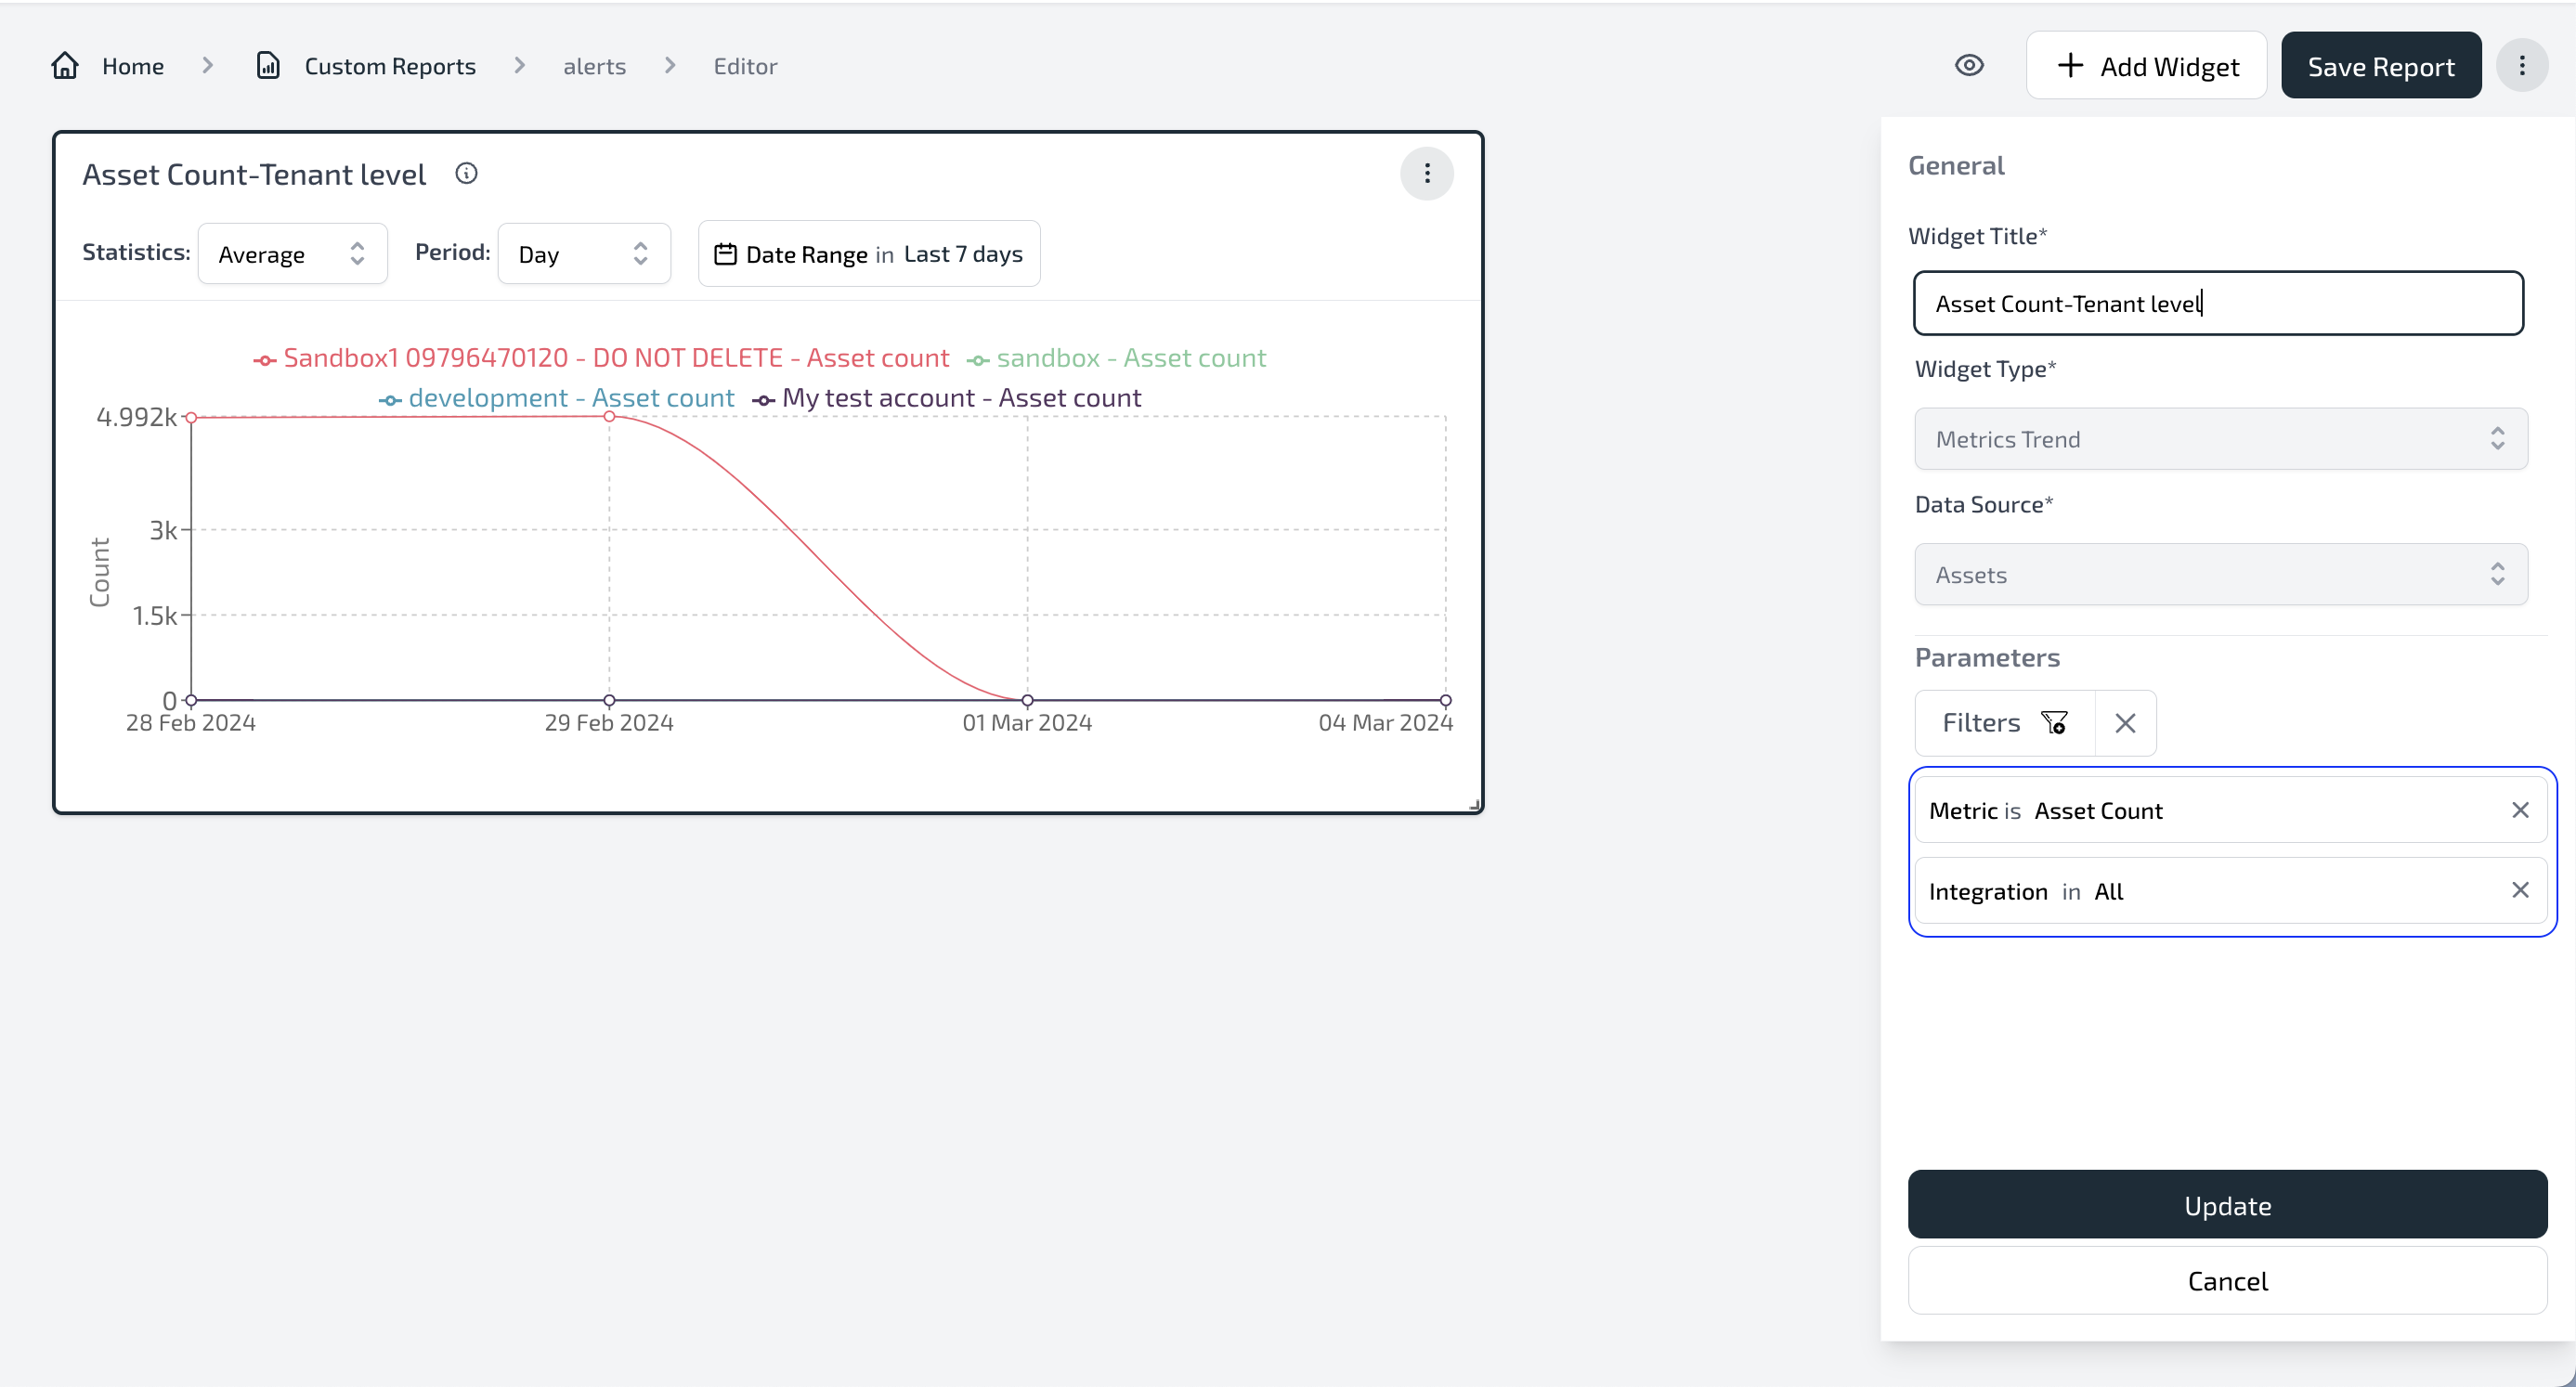
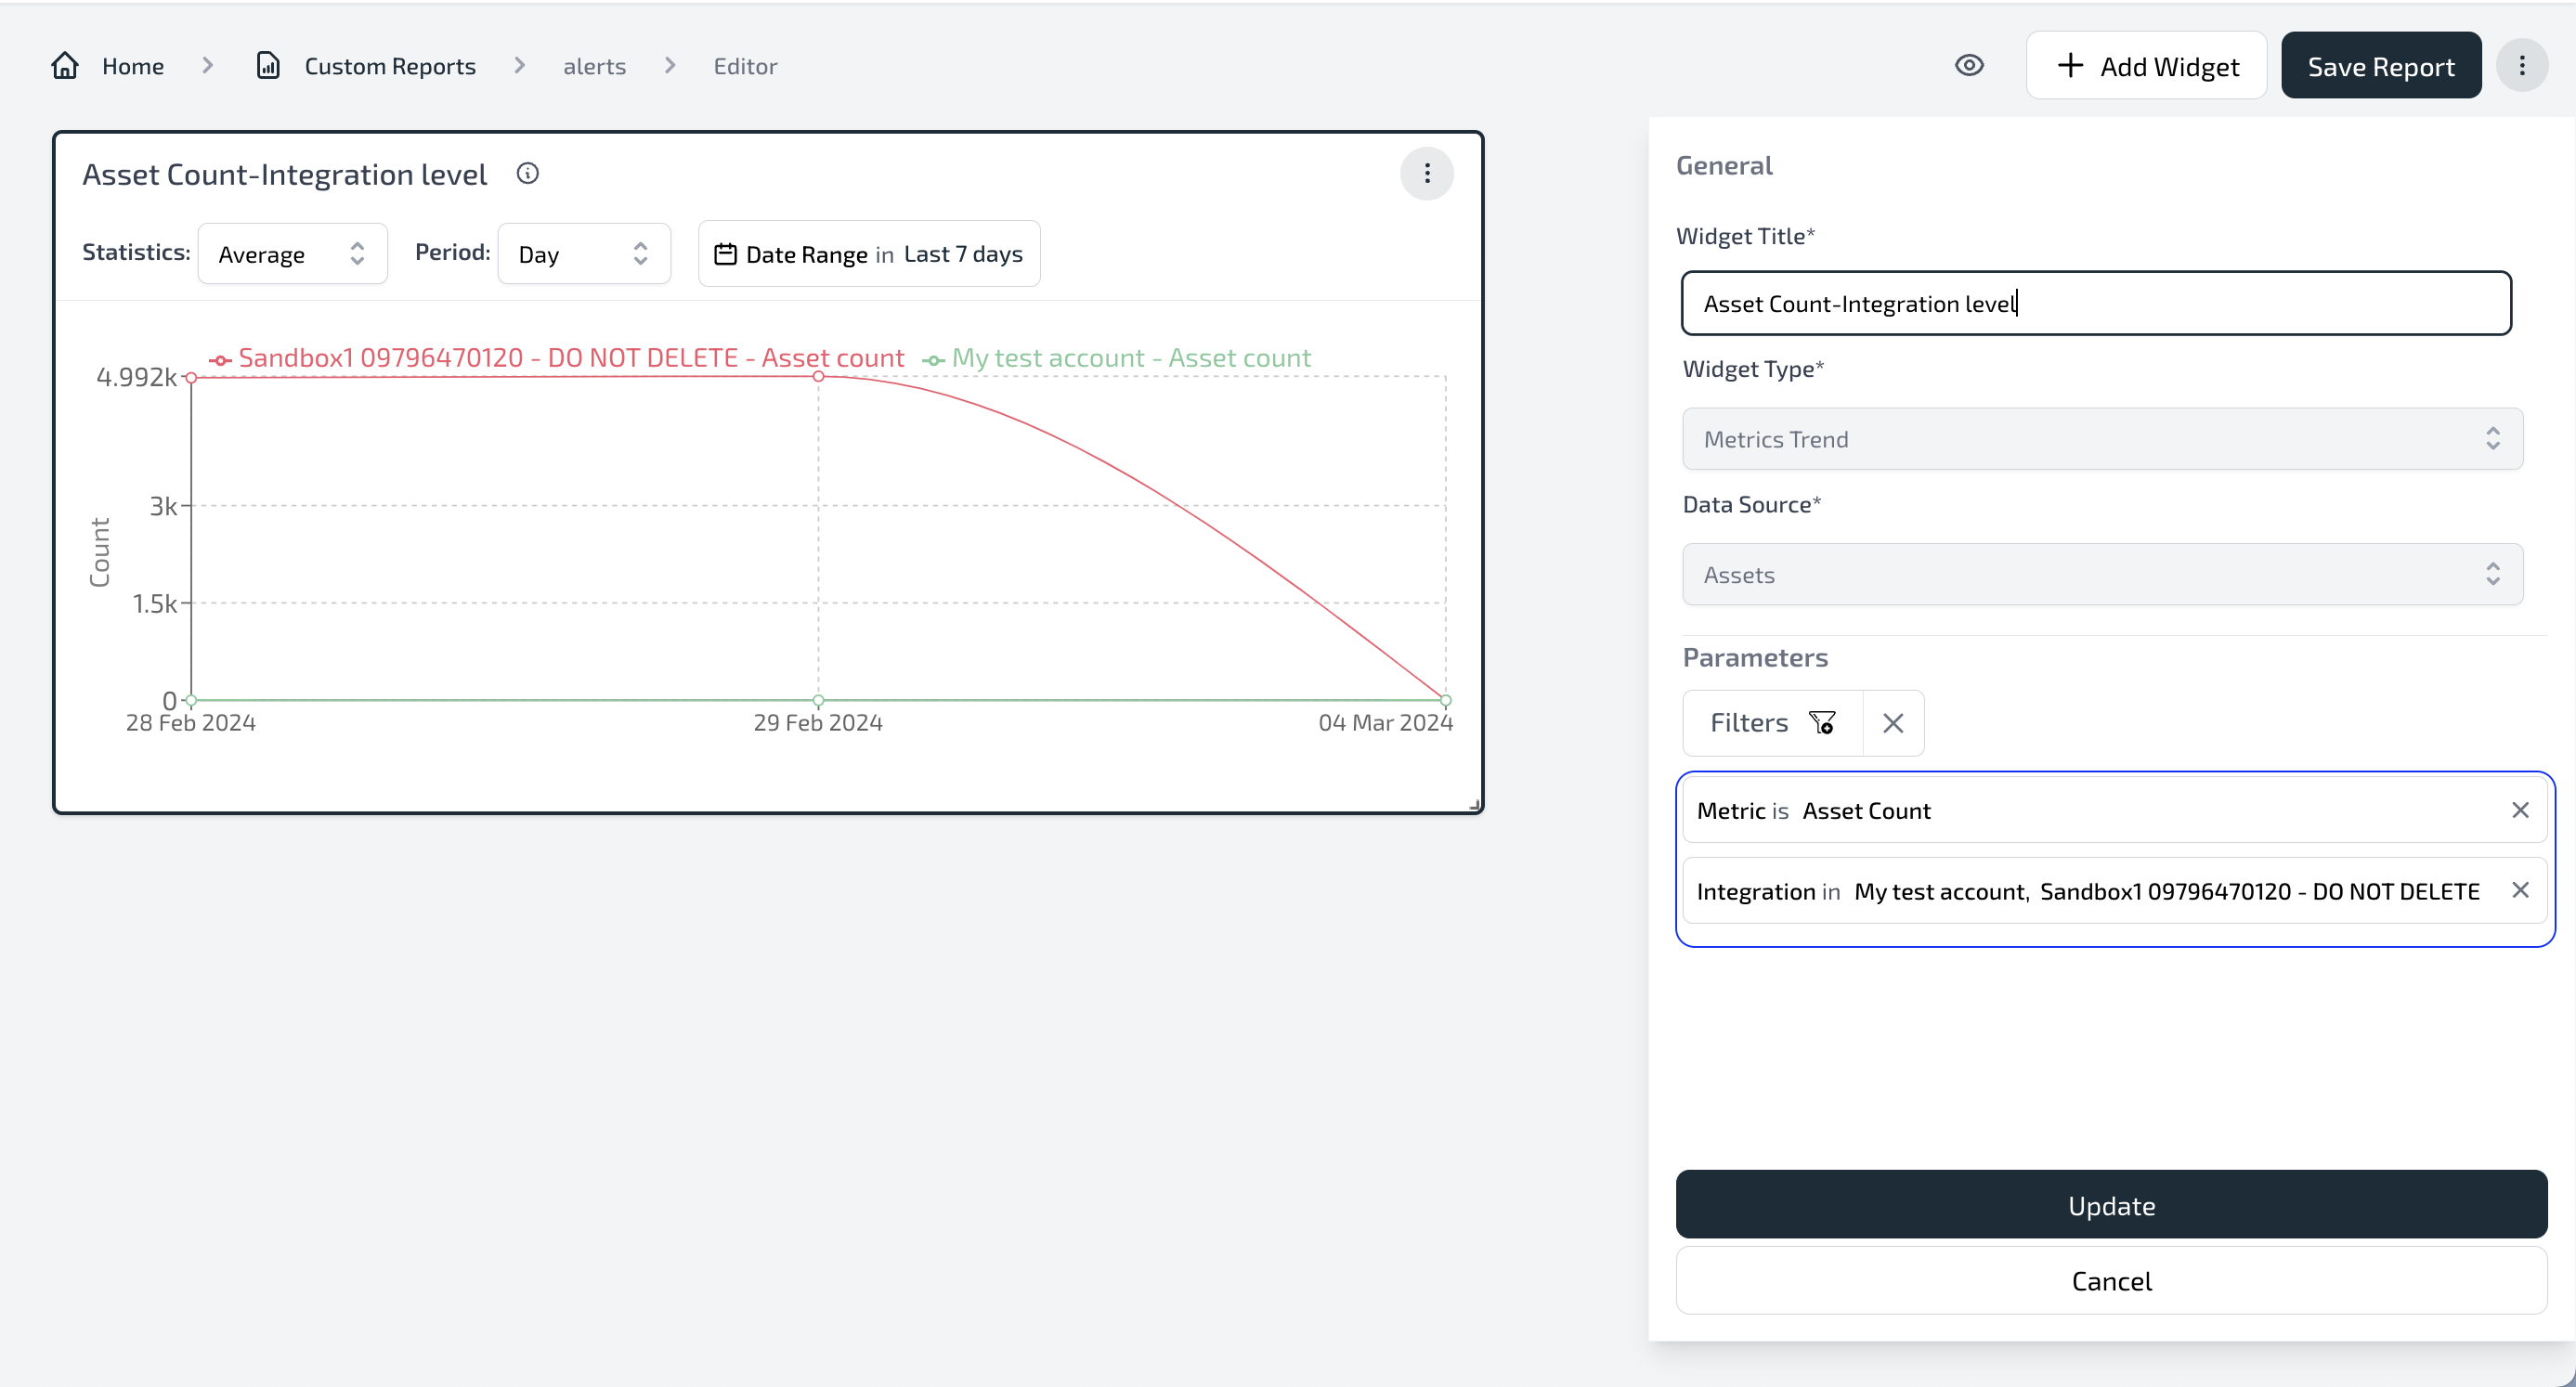
- Assets (integration-level metrics supported)
- Compliance (tenant-level metrics supported)
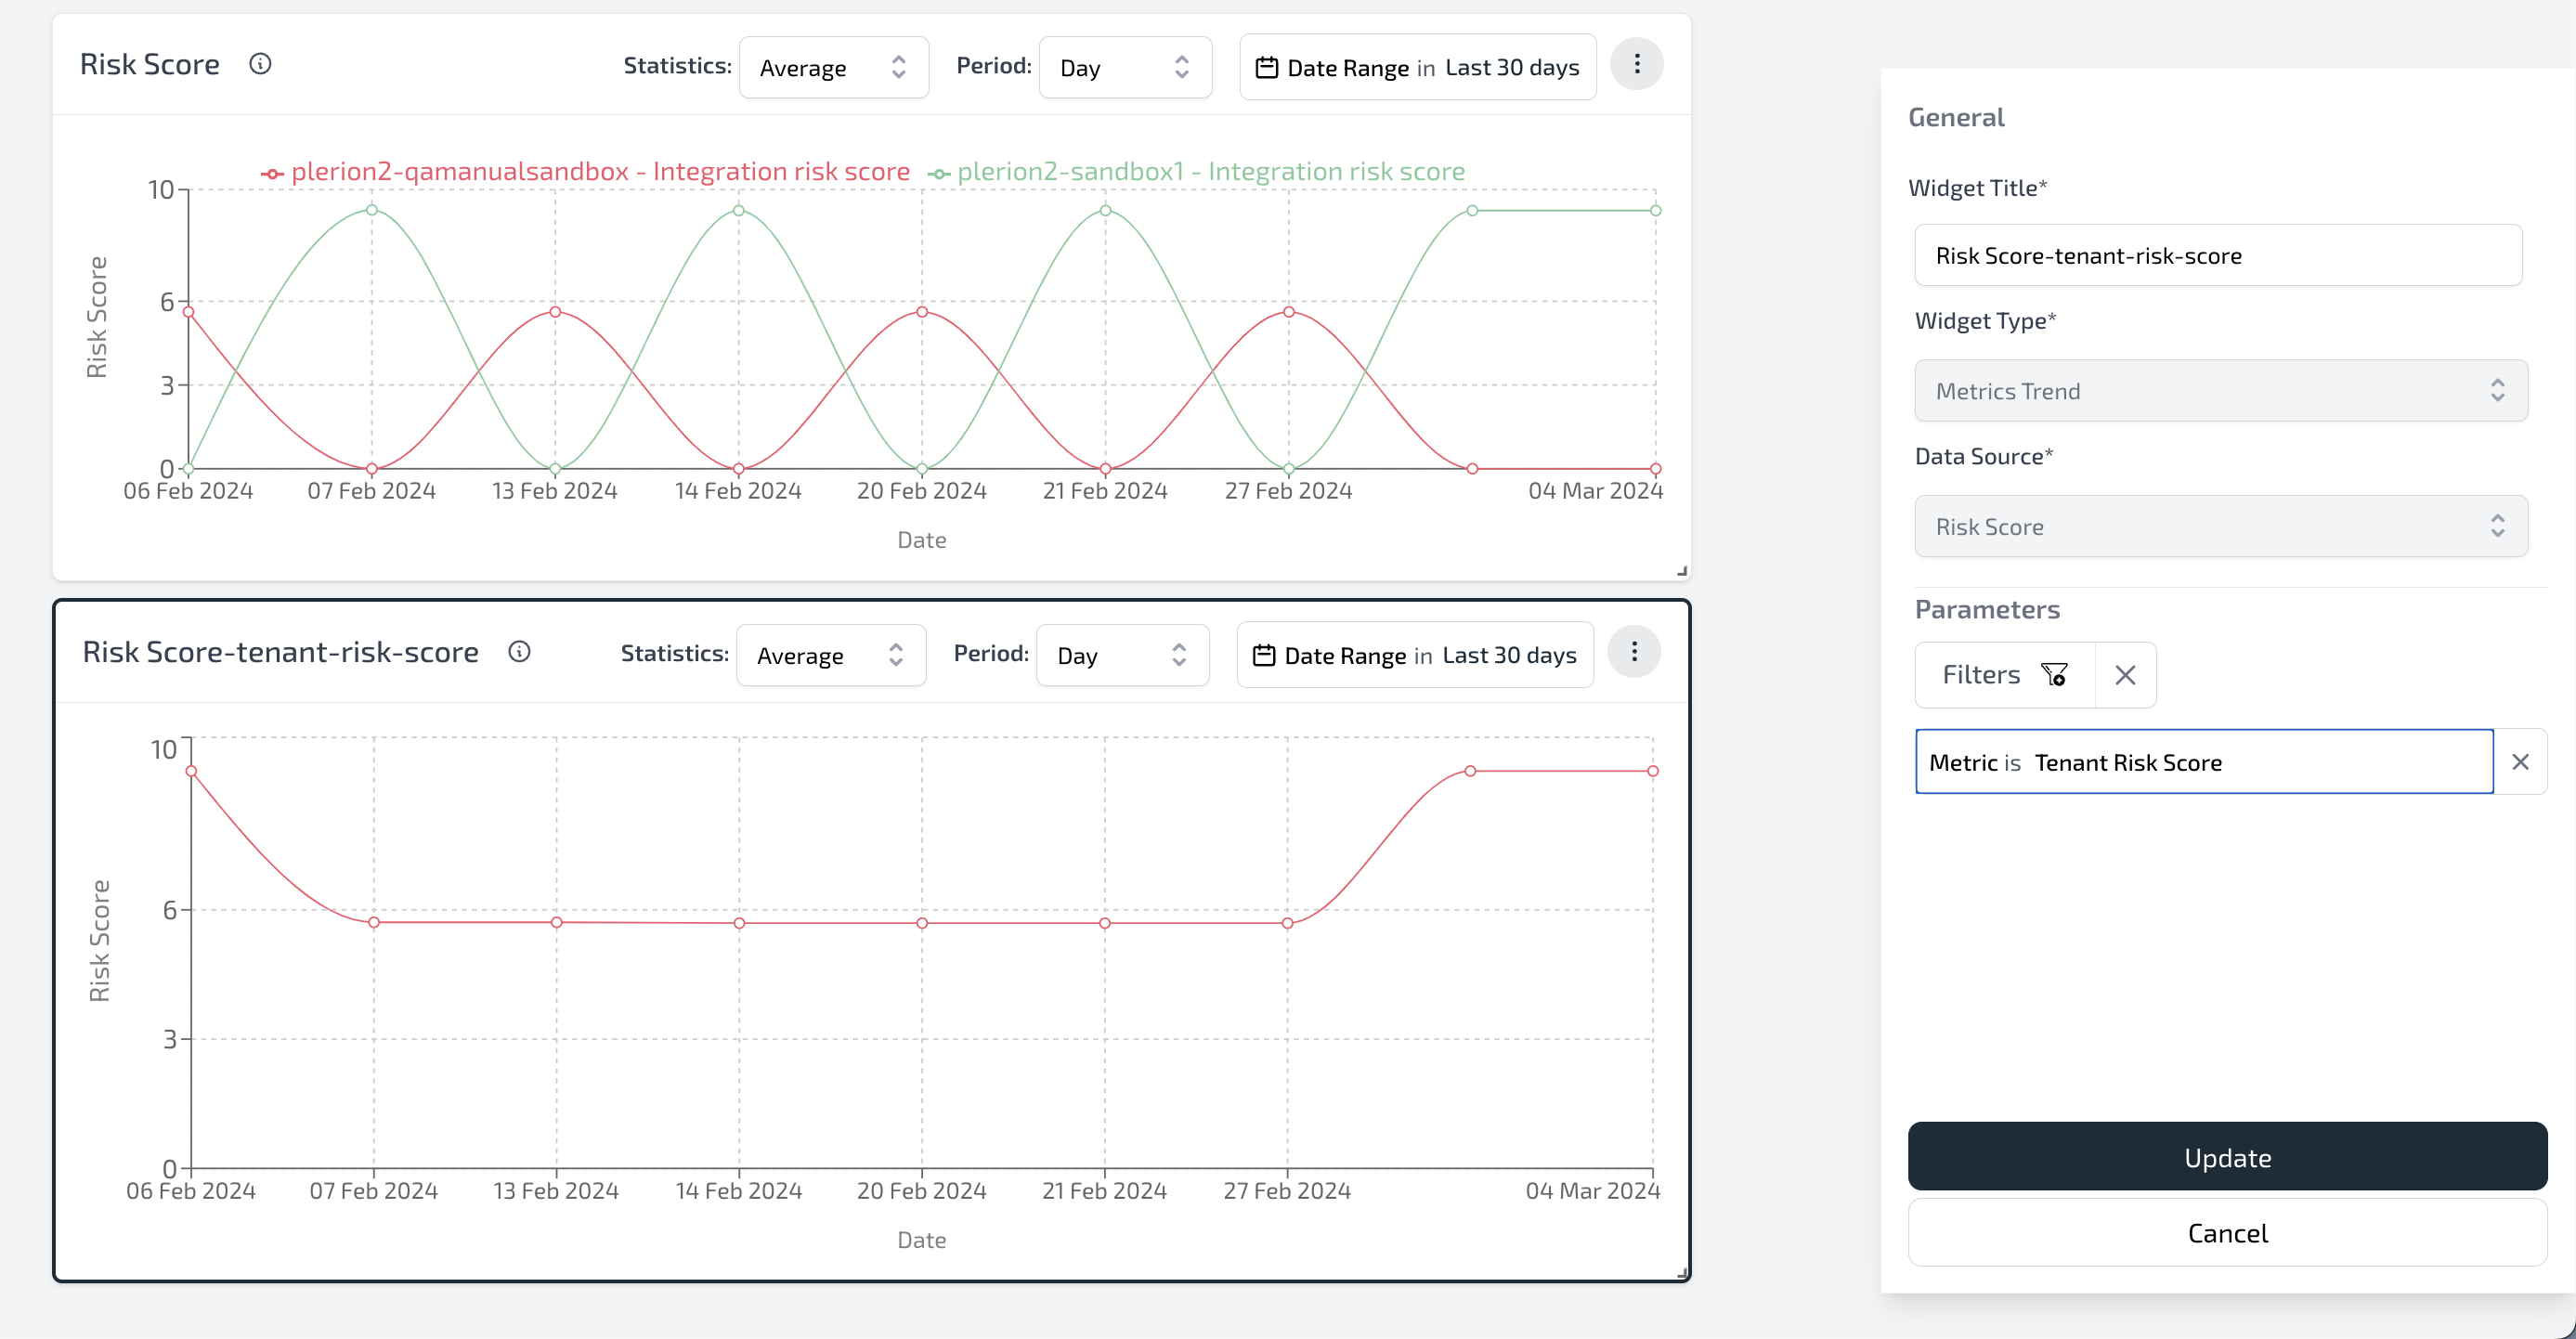
- Risk Score (tenant-level metrics supported)
- Vulnerabilities (integration-level metrics supported)
Available Filters
For all data sources, the Metrics Trend widget supports the following filters:
-
Metric: The Metric filter allows you to choose a specific data point for display within the 'Metrics Trend' widget. A metric can be any data point that you wish to showcase to the user. For example, it could represent failed findings, opened critical vulnerabilities, or any other meaningful metric that provides valuable insights over time. Explore the Metrics page for more in-depth insights into configuring metrics. This is particularly relevant when utilizing the 'Metric Trends' widget type with 'Vulnerabilities' or 'Assets' as the chosen data source.
-
Integration (Optional): Select specific integrations for Integration-level metrics, e.g., asset count. Note: This filter is hidden for some Tenant-Level Metrics like Risk Score and Compliance.
In addition to the Metrics and Integration filters, the 'Metrics Trend' widget offers additional refinement options through the following filters:
-
Statistics: Tailor how data points are summarized within each interval. Choose from four options – Sum, Average, Maximum, and Minimum – to shape the presentation of your trend chart based on your preference.
-
Period: Select the time interval for data grouping. Whether it's day, week, or month, this filter allows you to customize the granularity of your trend chart to suit your analytical needs.
-
Date Range: Define the specific time span for the trend chart. This empowers you to focus on a particular time frame, providing flexibility and precision in analyzing the selected metrics and integrations.
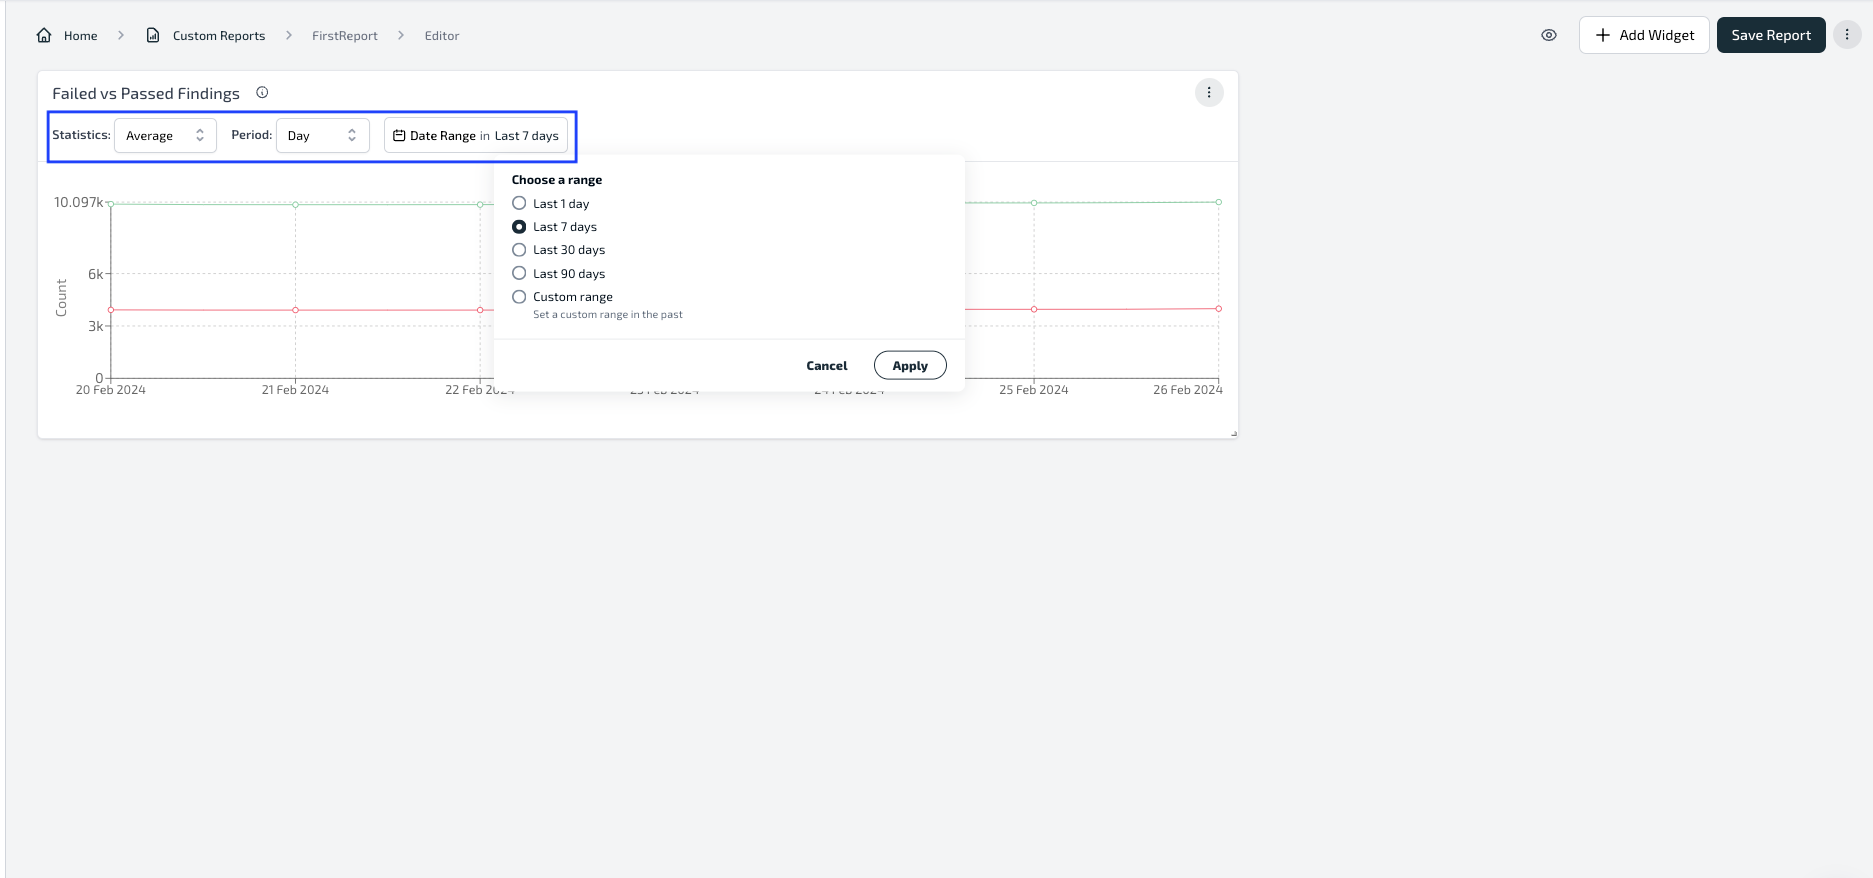
This trio of filters enhances your control over the displayed information, ensuring a nuanced and insightful representation of the data within the 'Metrics Trend' widget.
Integration and Tenant-Level Metrics
Integration-Level Metrics:
- These metrics, such as asset count, findings, and vulnerabilities, can be specific to individual integrations.
- The Integration filter lets you choose a particular integration to display metrics unique to that integration.
Tenant-Level Metrics:
- Metrics like Compliance and Risk Score operate at the overall tenant level.
- The data from all integrations contribute to Tenant-Level Metrics, providing a comprehensive view of compliance and risk across the entire environment.
- Notably, the Integration filter is inactive for Tenant-Level Metrics, as these metrics are not tied to a single integration. For instance, selecting an integration won't impact Tenant-Level Metrics like Compliance, ensuring a clear representation of overall compliance all integrations.
- When the Tenant Risk Score is chosen in the metric filter, we presently conceal the integration filter. However, the integration filter is visible if the user opts for the Integration Risk Score.
Example
Understanding Metrics for Tenant Level:
Imagine you have two integrations, A and B, with different scan intervals. Integration A is scanned by Plerion twice a day, and Integration B is scanned by Plerion four times a day. Here's how the metrics look for the entire day at the Tenant level:
-
Sum Asset Count: Add up all the asset counts published throughout the day. For example, if Integration A's runs published 9 and 12, and Integration B's runs published 20, 25, 10, and 20, then the total would be 96.
-
Average Asset Count: Calculate the average asset count for the day. Take the sum and divide it by the number of runs. In this case, it would be (9+12+20+25+10+20)/6, resulting in an average of 16.
-
Maximum Asset Count: Identify the highest asset count for the day. In the example, it's 25 from Integration B's second run.
-
Minimum Asset Count: Find the lowest asset count for the day. In this scenario, it's 9 from Integration A's first run.
Understanding Metrics for Integration Level (Integration A Selected):
If you choose Integration A as your filter, the metrics will focus only on Integration A's data:
-
Sum Asset Count: Add up the asset counts published by Integration A, which is 9+12 = 21.
-
Average Asset Count: Calculate the average asset count for Integration A, resulting in (9+12)/2 = 10.5.
-
Maximum Asset Count: Identify the highest asset count from Integration A, which is 12 from the second run.
-
Minimum Asset Count: Find the lowest asset count from Integration A, which is 9 from the first run.
Understanding Metrics for Integration Level (Integration B Selected):
If you choose Integration B as your filter, the metrics will focus only on Integration B's data:
-
Sum Asset Count: Add up the asset counts published by Integration B, which is 20+25+10+20 = 75.
-
Average Asset Count: Calculate the average asset count for Integration B, resulting in (20+25+10+20)/4 = 18.75.
-
Maximum Asset Count: Identify the highest asset count from Integration B, which is 25 from the second run.
-
Minimum Asset Count: Find the lowest asset count from Integration B, which is 10 from the third run.
In this example, the tenant-level metrics give an overview of the entire day's data, while integration-level metrics let you zoom in on specific integrations, like A or B, to understand their individual performance throughout the day. This flexibility allows you to tailor your analysis based on the level of detail you need!