Plerion Alert Dashboard
The Plerion Alert Dashboard offers a centralized view of all alerts generated for your tenant's assets across various cloud environments. This feature enables you to promptly identify and respond to potential security threats, thereby mitigating the risk of data breaches and other security incidents.
Alert Dashboard Video
Features
The Plerion Alert Dashboard provides a range of features designed to enhance the efficient management of alerts. Users have the flexibility to browse alerts in either list or detailed view, apply filters based on various criteria, sort alerts by risk score or discovery date, acknowledge or un-acknowledge alerts, flag alerts for increased visibility, remediate alerts, and exempt assets from detection conditions. Below is a brief description of each feature available in the Alert Dashboard:
Filters
The Plerion Alert Dashboard offers multiple filters to streamline and enhance the efficiency of finding specific alerts.
-
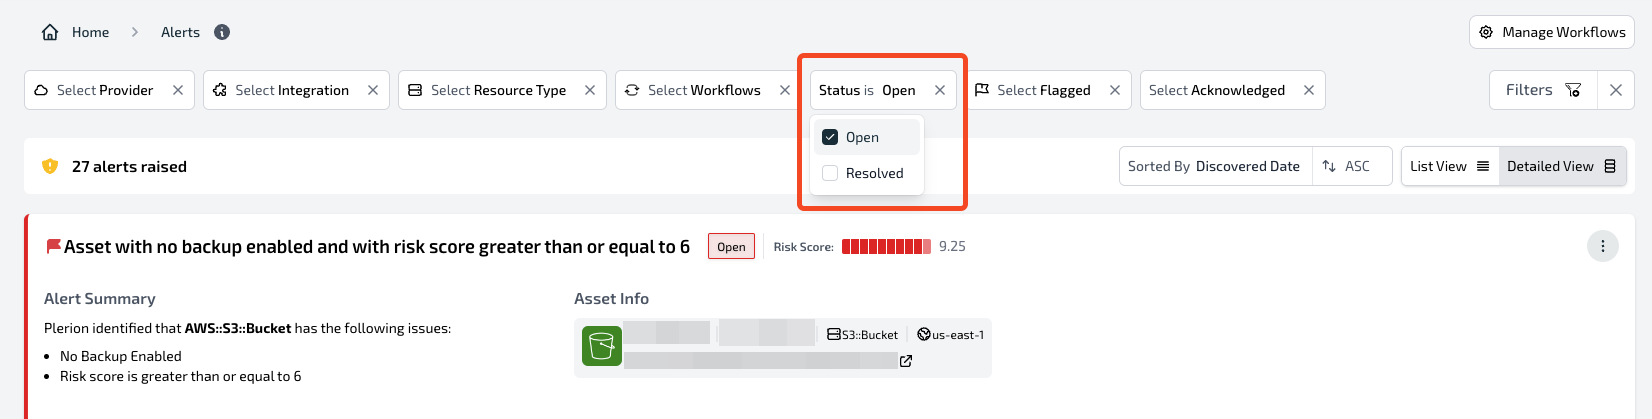
The Status filter can be used to list all 'Open' or 'Resolved' alerts.
-
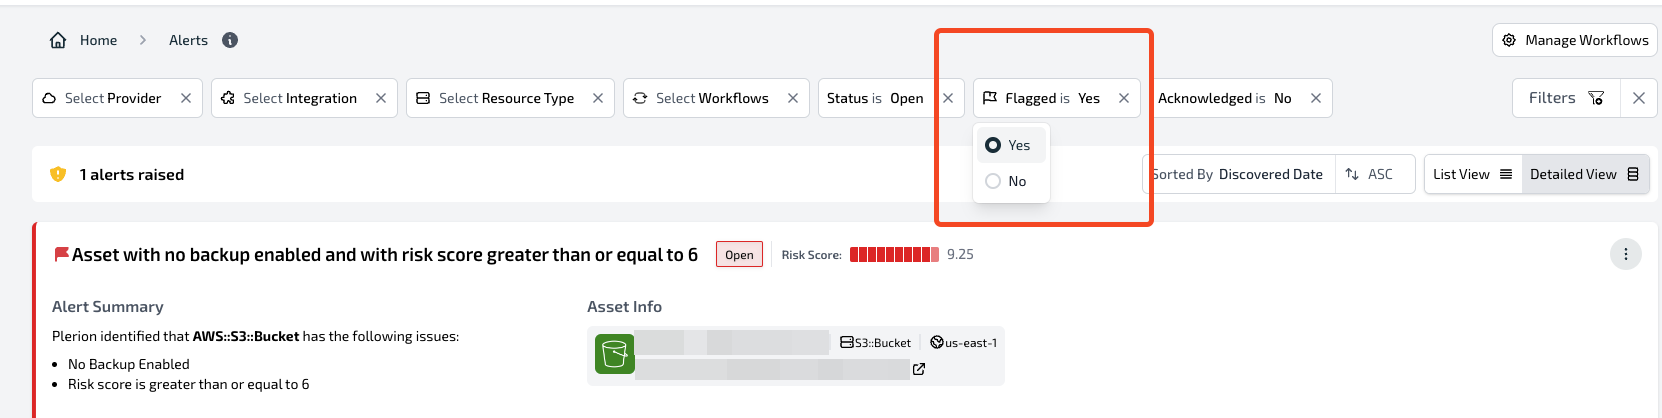
An alert can be flagged to highlight its importance. The 'Flagged' filter can be used to list all flagged alerts.
-
Other filters include:
- Provider: Filter alerts based on their provider (AWS, Azure, GCP, Kubernetes, etc.).
- Integration: Filter alerts based on their integration created in the Plerion Platform.
- Resource Type: Filter alerts based on the resource type (AWS::S3::Bucket, AWS::Lambda::Function, etc).
- Workflows: Filter alerts based on the specific workflow that triggered them.
- Acknowledged: An alert can be marked as acknowledged to suppress it. This filter can then be utilized to display only those alerts that have been acknowledged.
Sorting and Viewing
The Plerion Alert Dashboard provides sorting and viewing options to assist users in organizing and prioritizing their alerts.
Users have the option to sort alerts either in ascending or descending order based on the following criteria:
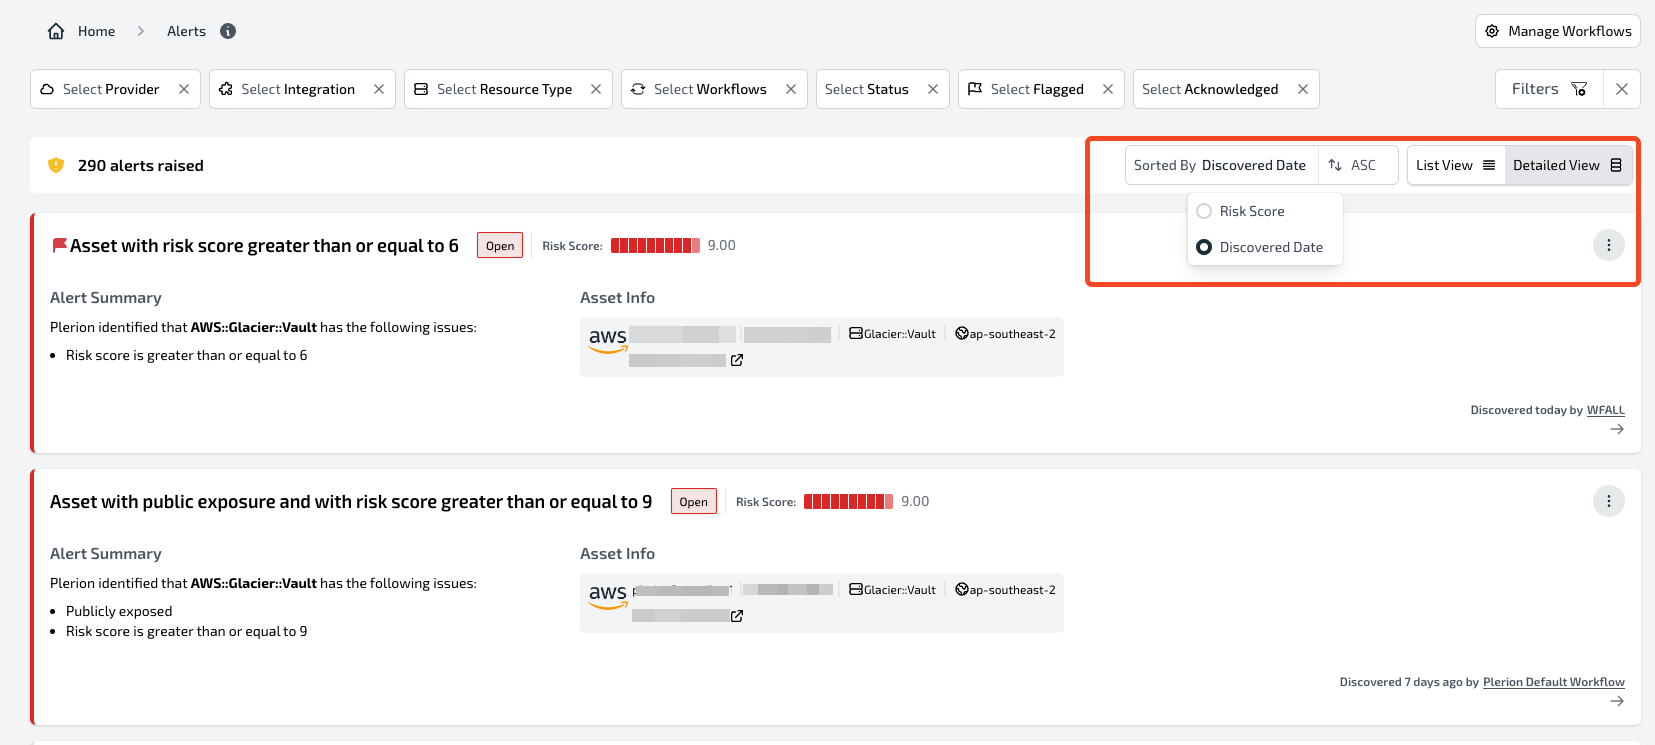
- Risk Score: Sort alerts based on their calculated risk score, ensuring that the most critical alerts appear at the top of the list.
- Discovered Date: Sort alerts in order of the date they were discovered, prioritizing the most recent alerts to appear at the top of the list.
Similarly, users have the flexibility to choose between two viewing options to display alerts:
- List view: Displays alerts in a compact table format with basic information.
- Detailed view: Provides detailed information about each alert, including the alert summary and asset information.
Acknowledge
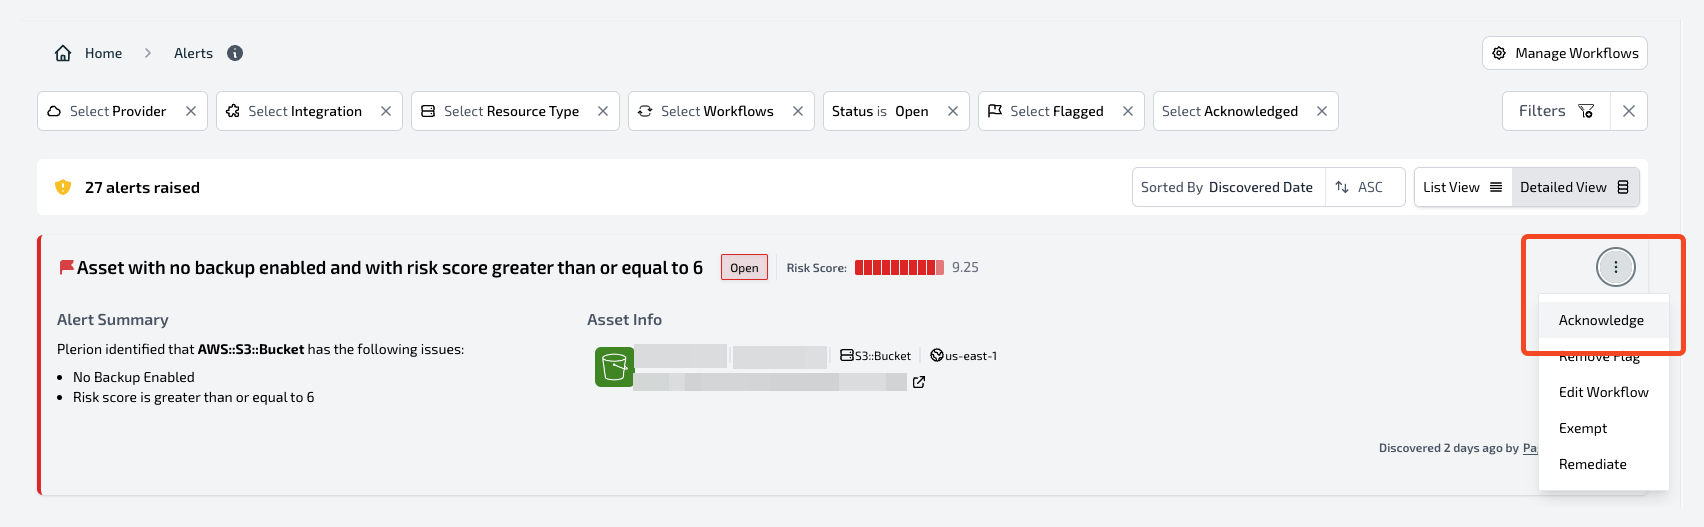
The Plerion Alert Dashboard provides users with the ability to acknowledge an alert. This action hides alerts from the dashboard, enabling teams to focus on addressing new threats introduced into the environment.
Users also have the option to include notes when acknowledging an alert. Acknowledging an alert will also automatically close the related alert in any outbound integrations configured by the user, such as Jira or Sentinel, as part of the workflow action.
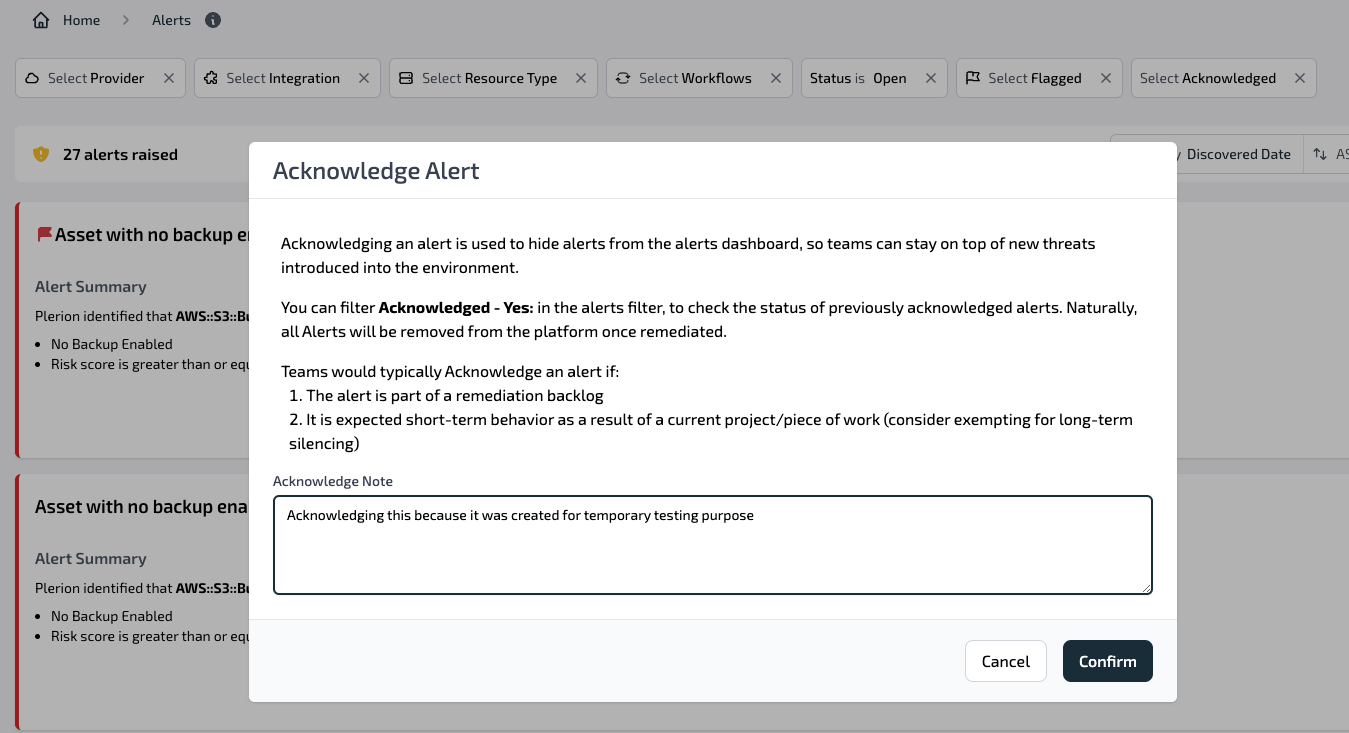
Users can filter Acknowledge - Yes in the alerts filter to list and review the status of previously acknowledged alerts. All alerts will be removed from the platform automatically once remediated.
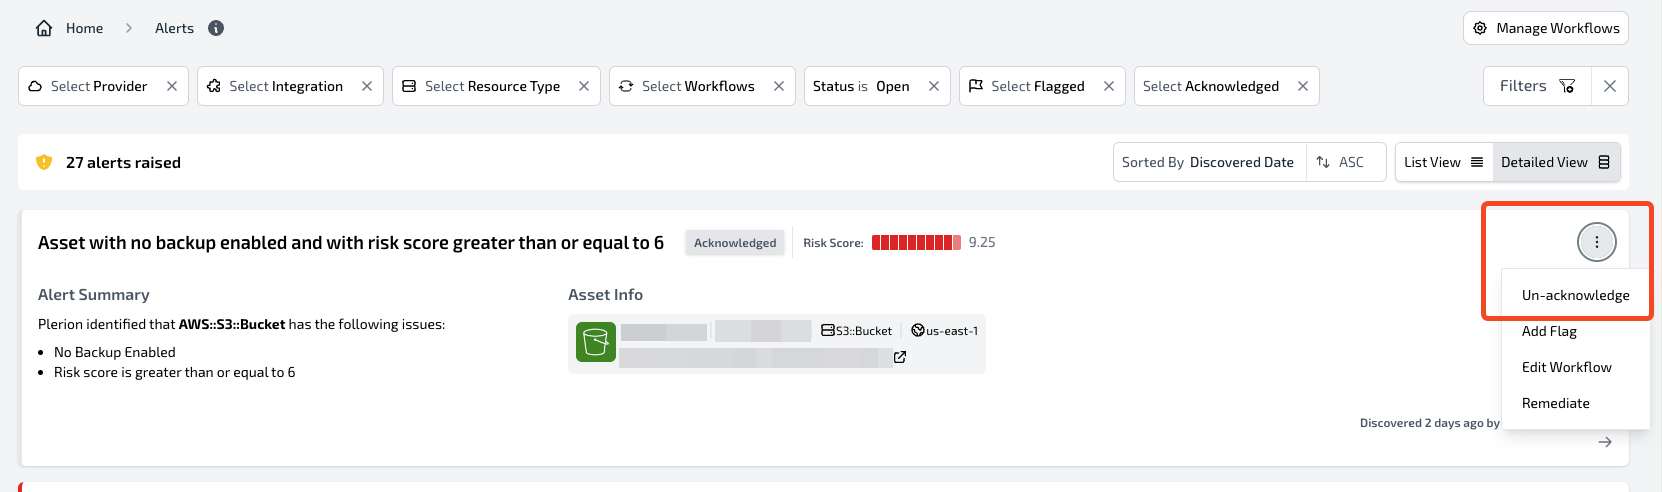
Similarly, users can also choose to Un-acknowledge an alert to reverse the acknowledged behavior. Unacknowledging an alert will cause it to reappear on the alerts dashboard and reopen any related alerts in outbound integrations. This can be useful if a team needs to revisit an alert that was previously acknowledged.
Flag
The Plerion Alert Dashboard empowers users to flag alerts for enhanced visibility and significance. Unlike acknowledging an alert, flagging an alert does not trigger any internal side effects, such as closing or reopening the alert in outbound integrations. Instead, flagging an alert serves as a method for teams to categorize alerts based on their criteria, such as relevance or priority. This enables teams to swiftly identify and address high-priority alerts, thereby improving overall threat response times.
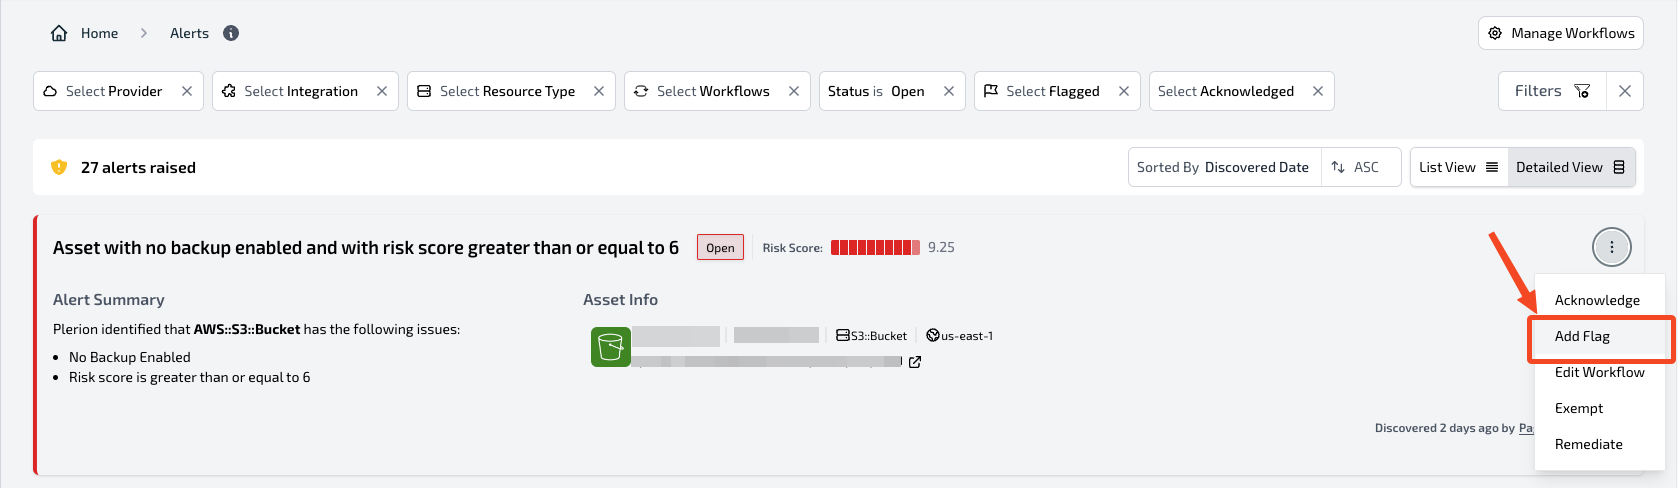
Users can utilize the Flagged - Yes filter in the alerts filter to list and review the status of all flagged alerts.
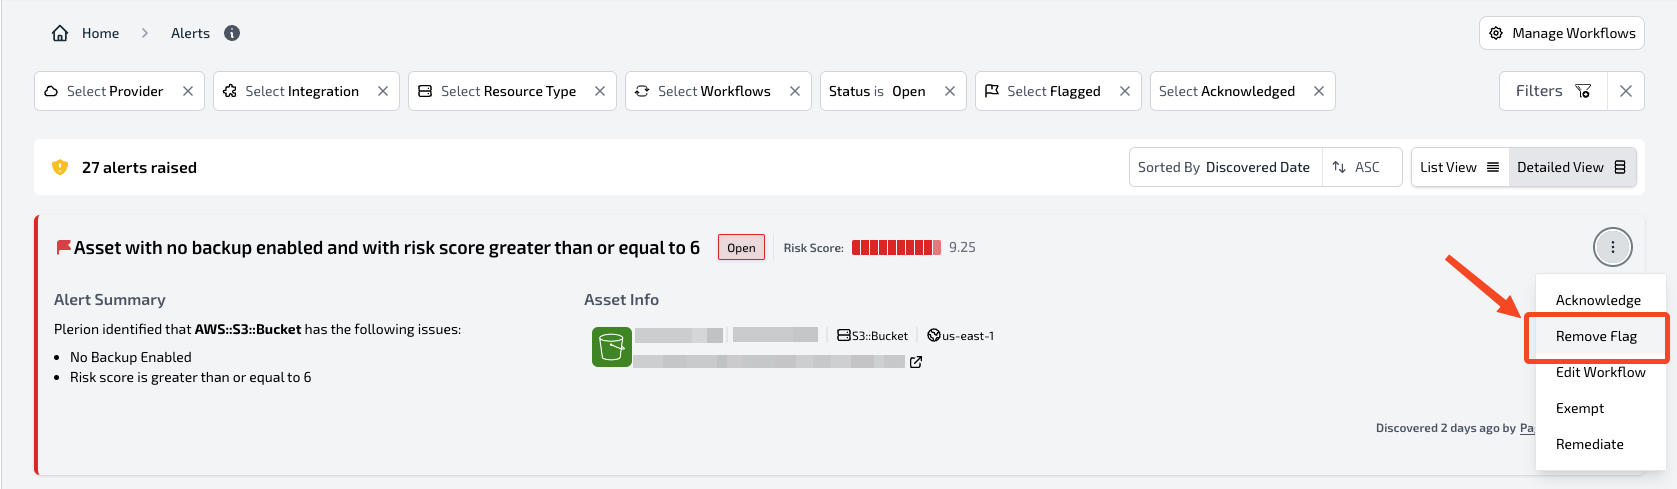
Similarly, users can Remove flags from alerts, just as they can flag alerts. This can be useful if a team determines that an alert is no longer of high priority or if the alert no longer requires attention.
Remediate
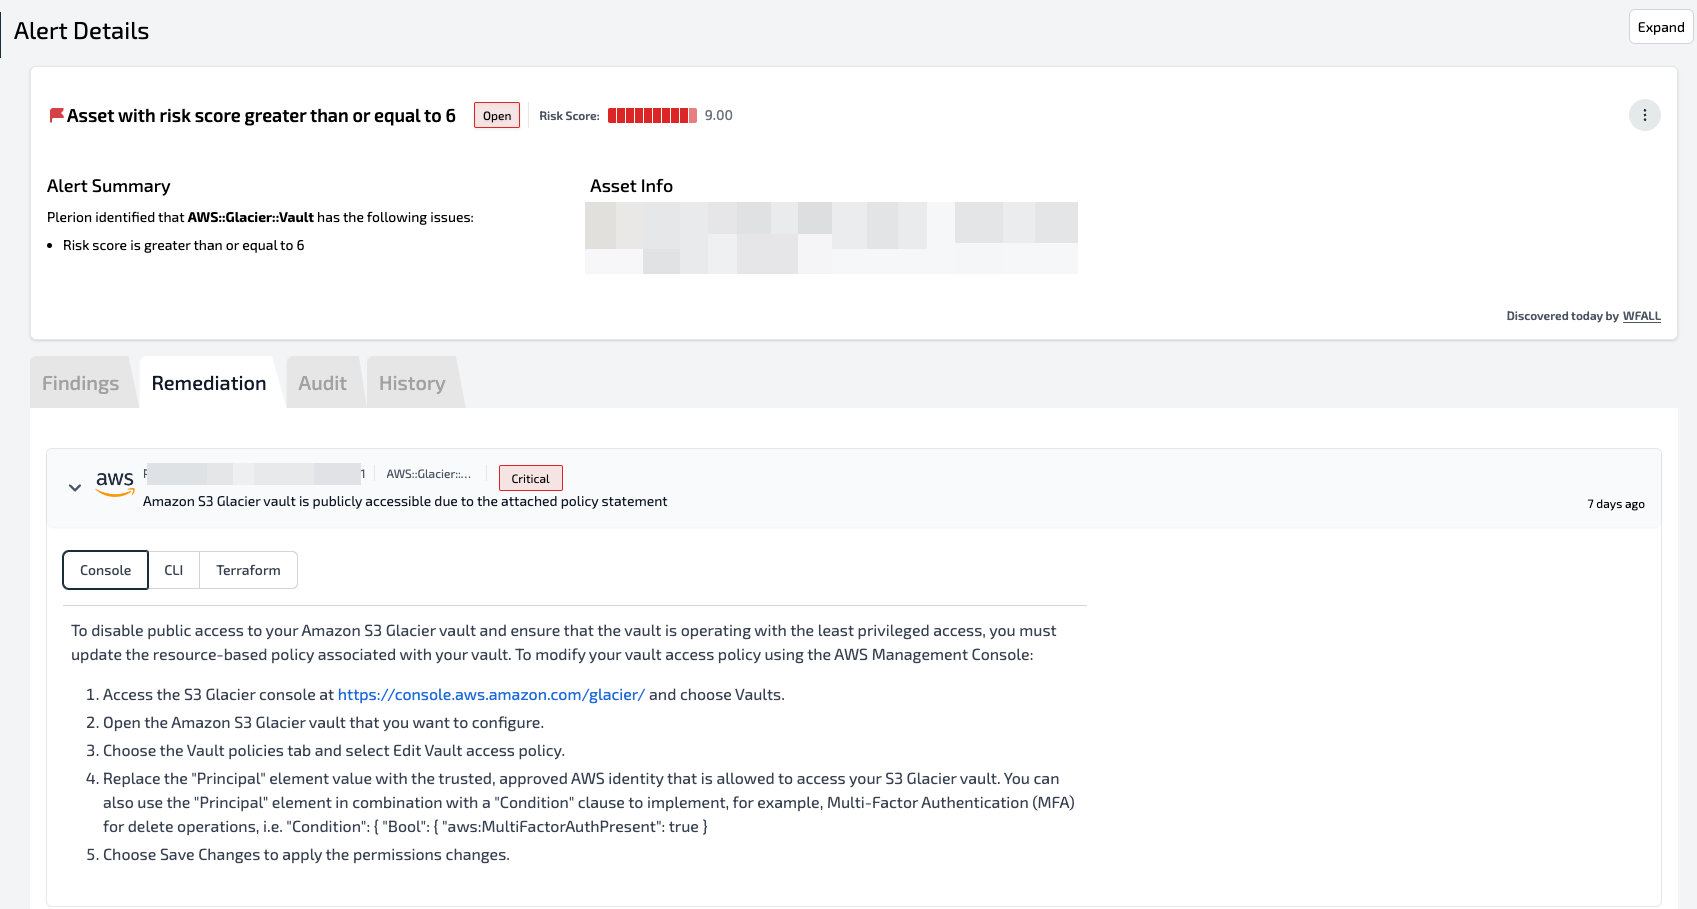
The Plerion Alert Dashboard provides a feature to help users understand the necessary steps to remediate an alert by clicking on the Remediate button.
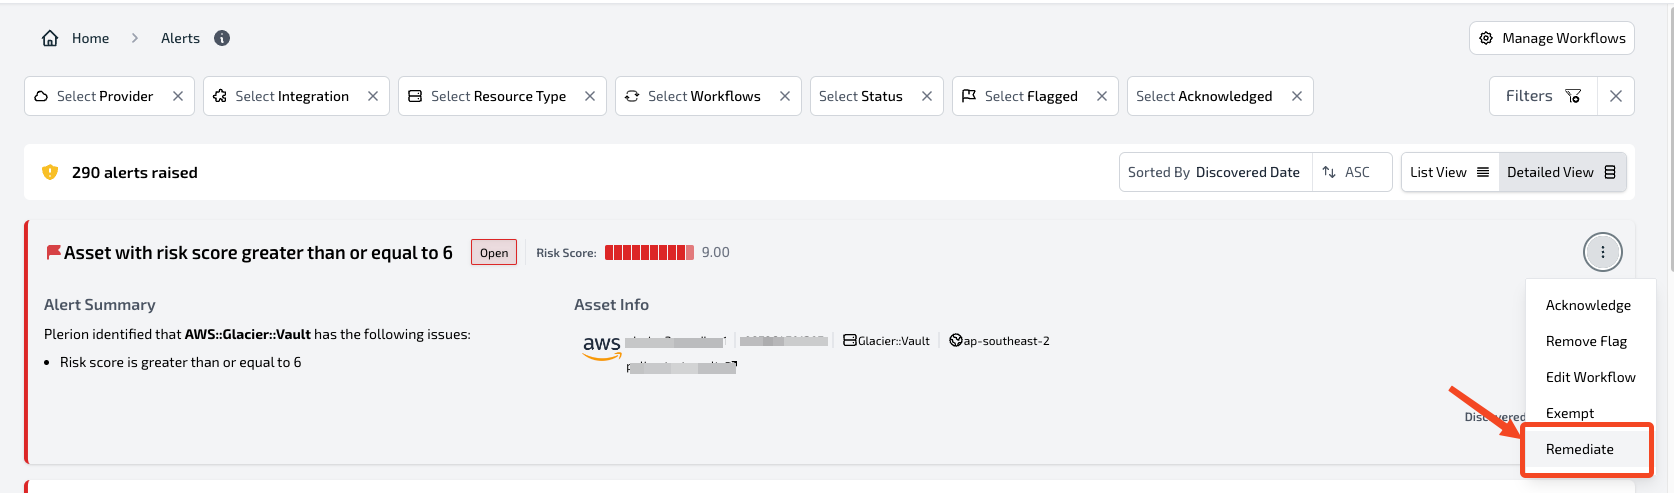
The Remediate button associated with an alert will open a contextual view displaying the remediation steps, that can be performed in the user's cloud environment to address the alert. This feature can assist teams in quickly identifying and implementing appropriate measures to mitigate the threat.
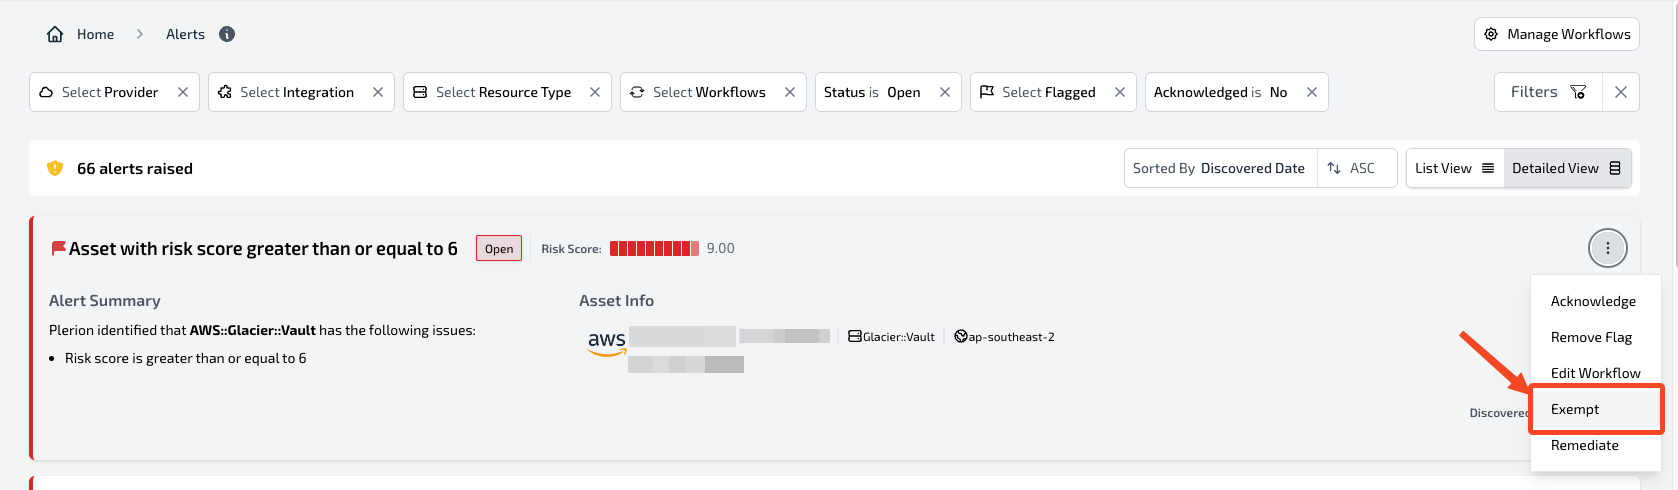
Exempt
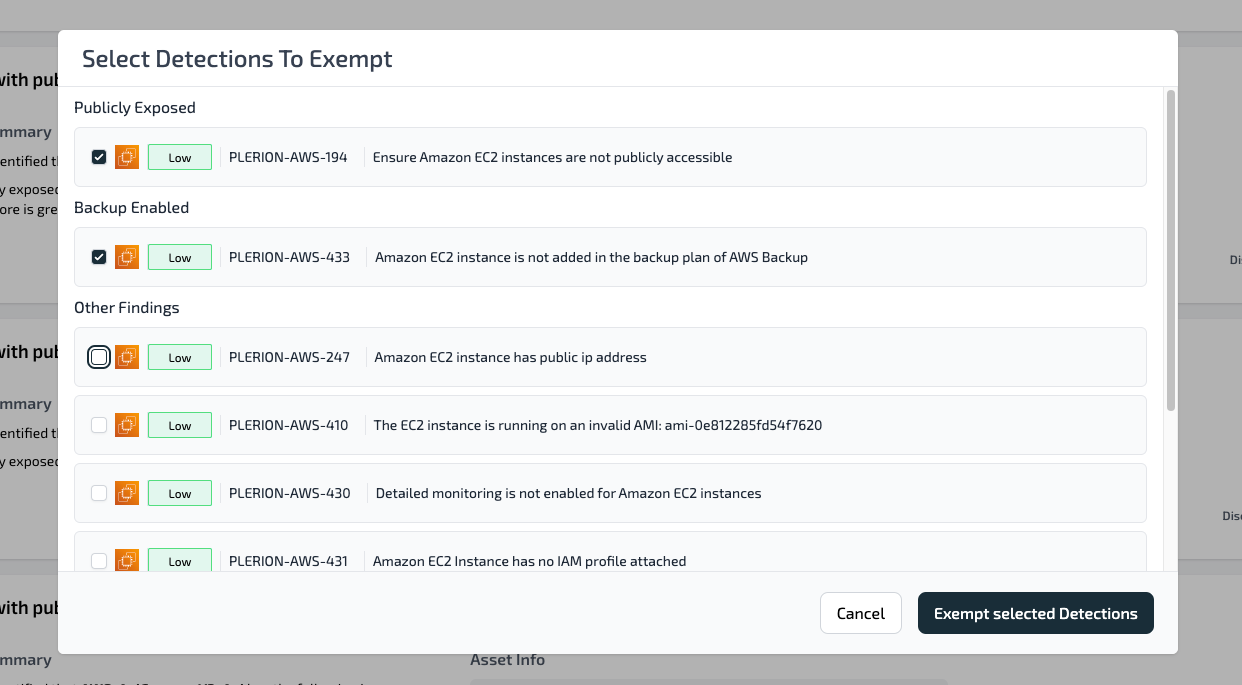
The Plerion Alert Dashboard provides users with the ability to ignore/exempt a detection from the assets evaluated by the workflow responsible for generating alerts. Sometimes teams might encounter an alert for an asset with detection that is acceptable or irrelevant to their specific environment. For such detection, teams can add exemptions, so that it will no longer appear on their Alerts dashboard.
For example, if a user exempts a detection related to an asset 'X' from the alert dashboard, then when the workflow runs again to generate alerts, any alerts related to the asset 'X' that include the exempted detection will be disregarded. Users have the flexibility to choose one or more specific detections to be exempt from the alert. Additionally, they can add an audit note related to the exemption. It's important to note that when an exemption is added for detection, it will apply to all workflows. This means that the exempted detection for the selected assets will be ignored by all workflows when generating alerts.
Teams would typically add an exemption if the associated asset's long-term configuration significantly differs from the defined risk parameters.