Methodology
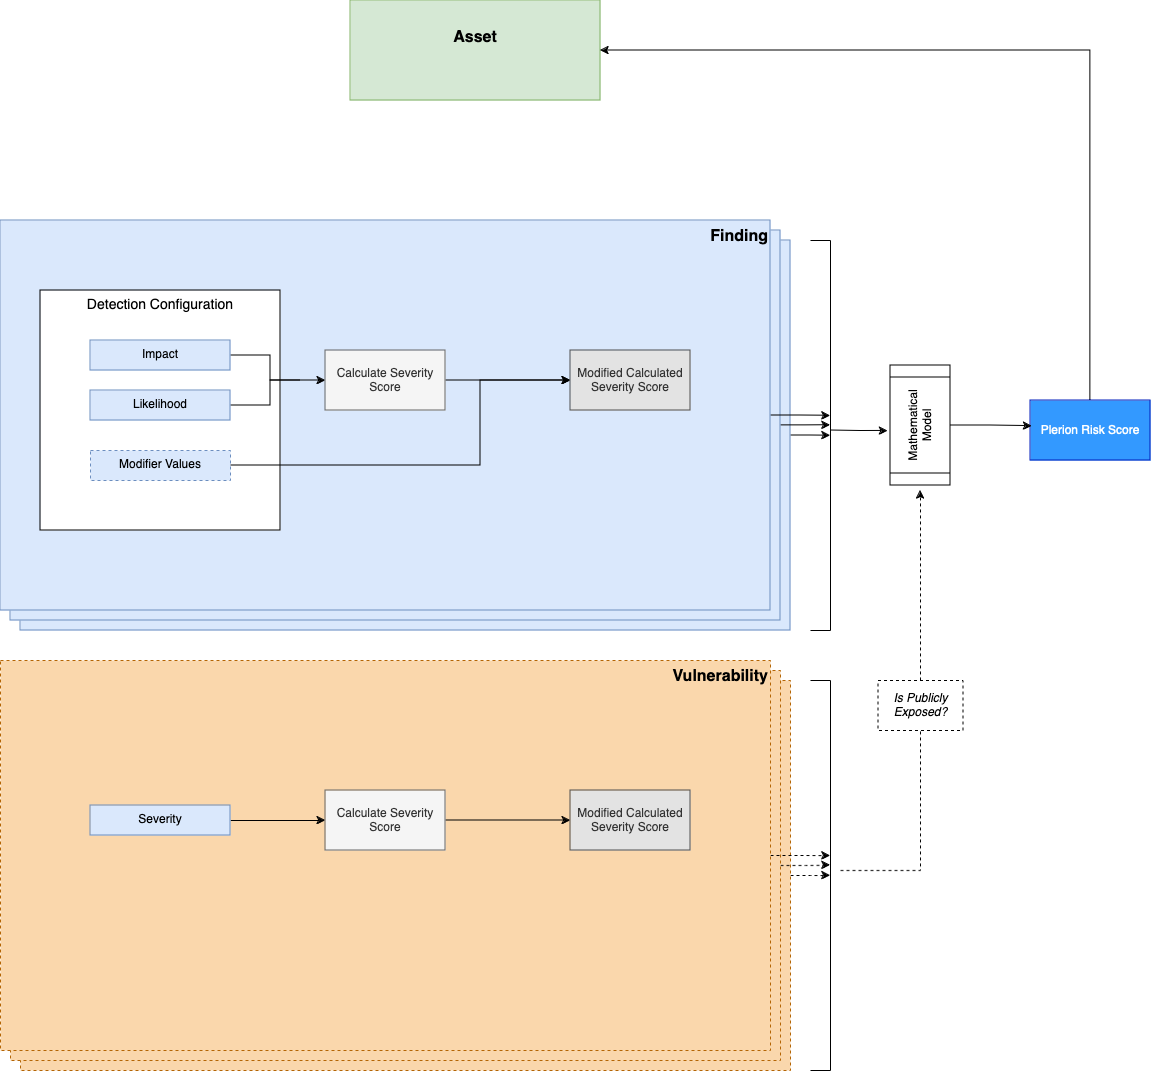
Under the hood, Plerion uses the Plerion Risk Calculator (PRC), a risk score calculation engine which when given an asset's findings and vulnerabilities as input, produces a risk score for the asset as the output.
Implementation Overview
The algorithm for assets is broken down into a findings algorithm for non-workload asset types, and a combination of the findings algorithm and a vulnerability severity algorithm for workload asset types.
Findings Algorithm
The findings risk score for an asset is calculated using a banding system that starts the score based on the highest severity level among failed findings. The algorithm then adjusts the score depending on the ratio of failed to passed and missing findings, ensuring the score remains within the appropriate band.
The severity levels and their corresponding bands are:
Low → (1...<3)
Medium → (3...<7)
High → (7...<9)
Critical → (9...10)
The process works as follows:
- Identify the Highest Severity Band: The algorithm begins by identifying the highest severity band among the failed findings.
- Edge Case Handling: If the asset has only failed findings (with no passed or missing findings), the score is set just below the start of the next highest band. This prevents the score from exceeding the current band too drastically.
- Calculate Failure Ratio: The failure ratio is determined by comparing the number of failed findings to the total number of findings (including passed and unknown).
- Apply Normalization Factor: A normalization factor specific to the highest severity band is applied to scale the score within the band's range.
- Compute the Risk Score: The final risk score is calculated by adding the highest severity band to the product of the failure ratio, a multiplier (10), and the normalization factor.
- Cap the Risk Score: The score is capped at a maximum of 10.
Example: Consider an S3 Bucket with the following findings:
Failed Severities: Critical, High
Passed Severities: Low, Medium
Unknown Severities: None
Using the findings risk score algorithm, the score for this S3 Bucket would start at the band for the highest failed severity (Critical, starting at 9). The score is then adjusted based on the failure ratio and normalization factor, resulting in a final risk score close to 9.8.
Vulnerability Algorithm
The vulnerability risk score algorithm calculates a risk score for an asset based on the severities of vulnerabilities it possesses. The algorithm uses a band system, similar to the one used for findings, but with specific limits for each severity level. The severity levels and their corresponding bands are:
Low → (1...<3)
Medium → (3...<7)
High → (7...<9)
Critical → (9...10)
Each severity level has a defined limit:
Low → 4000
Medium → 2000
High → 500
Critical → 100
Step-by-Step Process:
- Identify the Highest Severity: The algorithm begins by identifying the highest severity level present among the vulnerabilities.
- Start from the Highest Band: The risk score calculation starts at the band corresponding to the highest severity level. For example, if the highest severity is "Critical," the starting point is band 9.
- Calculate Remaining Band Range: The remaining range within which the score can increase is determined by the difference between the current band and the next highest band. For instance, if starting from band 9, the range to the next band (10) is 1.
- Evaluate Severity Levels: The algorithm then checks for vulnerabilities in lower severity levels (High, Medium, Low) and calculates their contribution to the risk score. The contribution is based on the ratio of the number of vulnerabilities to the severity limit and is weighted according to the remaining band range.
- Aggregate Contributions: Contributions from lower severity levels are progressively added to the risk score. The critical vulnerabilities contribute the most, followed by high, medium, and low severities.
- Cap the Final Score: The final risk score is capped at a maximum of 10 to ensure it stays within a standardized range.
Example:
For an EC2 instance with 5 critical vulnerabilities, 25 high vulnerabilities, and 100 medium vulnerabilities:
Highest Severity: Critical, so start at band 9.
Remaining Band Range: 1 (10 - 9).
Critical Contribution: 5/100 = 0.05. The score becomes 9 + 0.05 = 9.05.
High Contribution: 25/500 = 0.05. The score becomes 9.05 + (0.05 / 2) = 9.075.
Medium Contribution: 100/2000 = 0.05. The score becomes 9.075 + (0.05 / 4) = 9.0875.
The resulting risk score for this instance would be approximately 9.0875
Application to resource types
Above we have defined the finding and vulnerability algorithms. They are applied as follows:
- For non-workloads: 100% of the risk score is attributed to the finding algorithm
- For workloads that are not publicly accessible: 80% from the finding algorithm, 20% from the vulnerability algorithm
- For workloads that are publicly accessible: 50% from the finding algorithm, 50% from the vulnerability algorithm
Integration and Tenant Algorithm
The risk score for a tenant or integration is calculated using a banded algorithm that aggregates the risk scores of individual assets. This algorithm is designed to compare tenants or integrations with an equal number of assets, as having more or fewer assets can influence the overall risk score.
The algorithm works as follows:
- Determine the Band Range: The algorithm first identifies the appropriate band range for the risk scores by examining the highest leading integer among the asset risk scores. The possible band ranges are:
- Low Band: 0 - 4
- Medium Band: 4 - 6
- High Band: 6 - 8
- Critical Band: 8 - 10
- Calculate the Sum of Risk Scores: The sum of all the asset risk scores is calculated.
- Compute the Risk Score to Worst-Case Ratio: The algorithm computes the ratio of the sum of risk scores to the worst-case scenario (where all assets have a risk score of 10).
- Adjust the Risk Score by Band: The final risk score is adjusted within the identified band range by applying the ratio of risk scores to the worst-case scenario.
- Set Decimal Precision: The final risk score is rounded to three decimal places to maintain consistency.
Example: Consider a scenario where an integration has three assets with the following risk scores: 10, 9, and 8.
The algorithm will:
- Identify the highest leading integer (10) and start the calculation in the Critical Band (8 - 10).
- Calculate the sum of risk scores: 10 + 9 + 8 = 27.
- Compute the risk score to worst-case ratio: 27 / 30 = 0.9.
- Adjust the risk score within the Critical Band: 8 + 0.9 × 2 = 9.8.
In this example, the integration would have a final risk score of approximately 9.8, indicating a high level of risk.
Depiction